> ## Documentation Index
> Fetch the complete documentation index at: https://docs.getlago.com/llms.txt
> Use this file to discover all available pages before exploring further.
# Performance & Optimization
> Lago's event processing architecture, production benchmarks, throughput by connector, and optimization strategies for engineering teams.
This page covers Lago's **event processing architecture**, **production benchmarks**, **throughput by connector**, and **optimization strategies**. It's the reference for engineering teams evaluating whether Lago can handle their event volume, and how to configure it for peak performance.
For event design, use cases, and integration code, see [Ingesting usage](/guide/events/ingesting-usage).
***
## Architecture: how Lago processes events at scale
Under the hood, Lago's high-volume pipeline is built on **Kafka/Redpanda** for streaming and **ClickHouse** for storage and aggregation.
### The pipeline
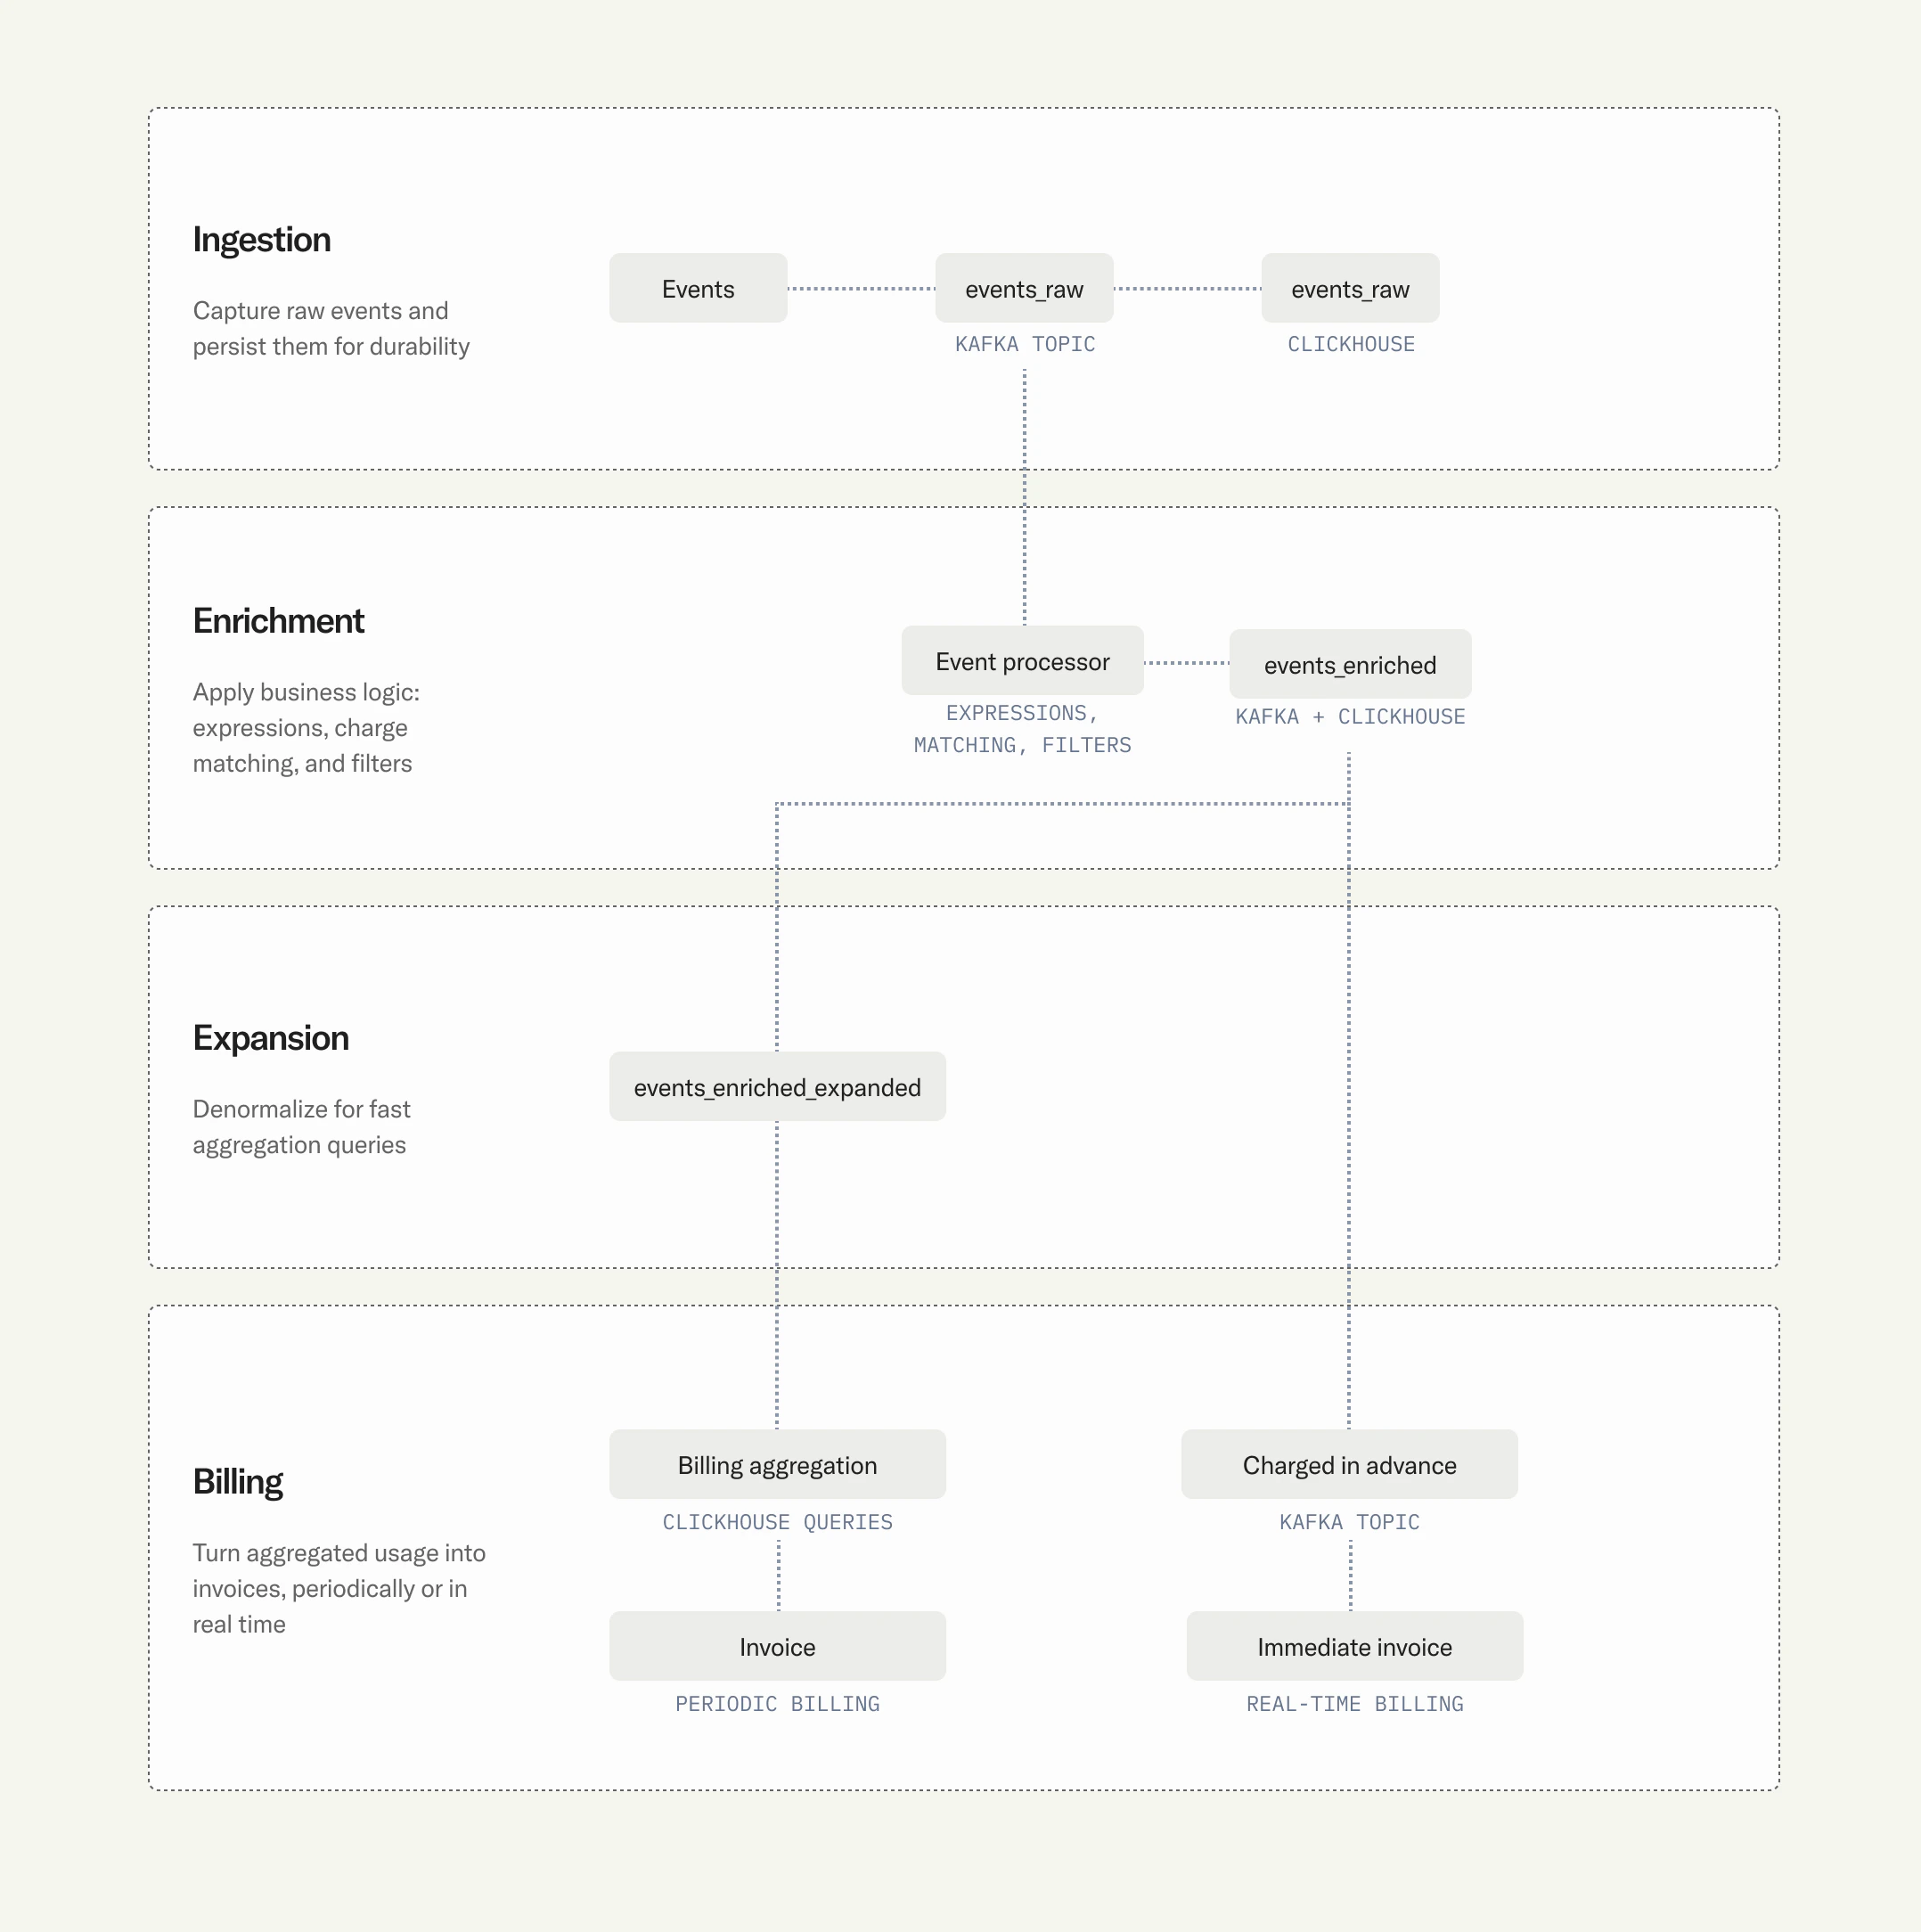 Event lands on `events_raw` Kafka topic, then persisted to `events_raw` ClickHouse table (audit trail).
Event processor evaluates custom expressions, extracts the metered value, matches to subscription/plan/charge, and applies charge filters (most-specific-match wins).
Enriched event written to `events_enriched` topic and ClickHouse table with full billing context.
Events expanded across charge filter matches into `events_enriched_expanded` table for granular aggregation.
Events matching pay-in-advance charges routed through `events_charged_in_advance` topic for immediate invoicing.
At invoice time, aggregation queries run directly on ClickHouse. Columnar storage enables billion-row aggregations in milliseconds.
### Why ClickHouse?
Compared to row stores. Billions of events stored efficiently.
Over massive datasets. Same queries power invoices and real-time usage dashboards.
No ETL layer between Kafka and storage.
Raw, enriched, and expanded events all queryable.
### Data tables
| Table | Contents | Purpose |
| -------------------------- | ---------------------------------------------------- | ---------------------- |
| `events_raw` | Events exactly as received | Audit trail, debugging |
| `events_enriched` | Events + subscription, plan, charge, extracted value | Billing aggregation |
| `events_enriched_expanded` | Events expanded across charge filter matches | Dimensional billing |
### Self-hosted vs. Lago Cloud
ClickHouse and Kafka managed for you. You just send events.
Full control over scaling, retention, and tuning. Requires manual administration of ClickHouse and Redpanda in your infrastructure.
For the full technical deep dive: [ClickHouse case study on Lago's architecture](https://clickhouse.com/blog/lago).
***
## Production benchmarks
Event lands on `events_raw` Kafka topic, then persisted to `events_raw` ClickHouse table (audit trail).
Event processor evaluates custom expressions, extracts the metered value, matches to subscription/plan/charge, and applies charge filters (most-specific-match wins).
Enriched event written to `events_enriched` topic and ClickHouse table with full billing context.
Events expanded across charge filter matches into `events_enriched_expanded` table for granular aggregation.
Events matching pay-in-advance charges routed through `events_charged_in_advance` topic for immediate invoicing.
At invoice time, aggregation queries run directly on ClickHouse. Columnar storage enables billion-row aggregations in milliseconds.
### Why ClickHouse?
Compared to row stores. Billions of events stored efficiently.
Over massive datasets. Same queries power invoices and real-time usage dashboards.
No ETL layer between Kafka and storage.
Raw, enriched, and expanded events all queryable.
### Data tables
| Table | Contents | Purpose |
| -------------------------- | ---------------------------------------------------- | ---------------------- |
| `events_raw` | Events exactly as received | Audit trail, debugging |
| `events_enriched` | Events + subscription, plan, charge, extracted value | Billing aggregation |
| `events_enriched_expanded` | Events expanded across charge filter matches | Dimensional billing |
### Self-hosted vs. Lago Cloud
ClickHouse and Kafka managed for you. You just send events.
Full control over scaling, retention, and tuning. Requires manual administration of ClickHouse and Redpanda in your infrastructure.
For the full technical deep dive: [ClickHouse case study on Lago's architecture](https://clickhouse.com/blog/lago).
***
## Production benchmarks
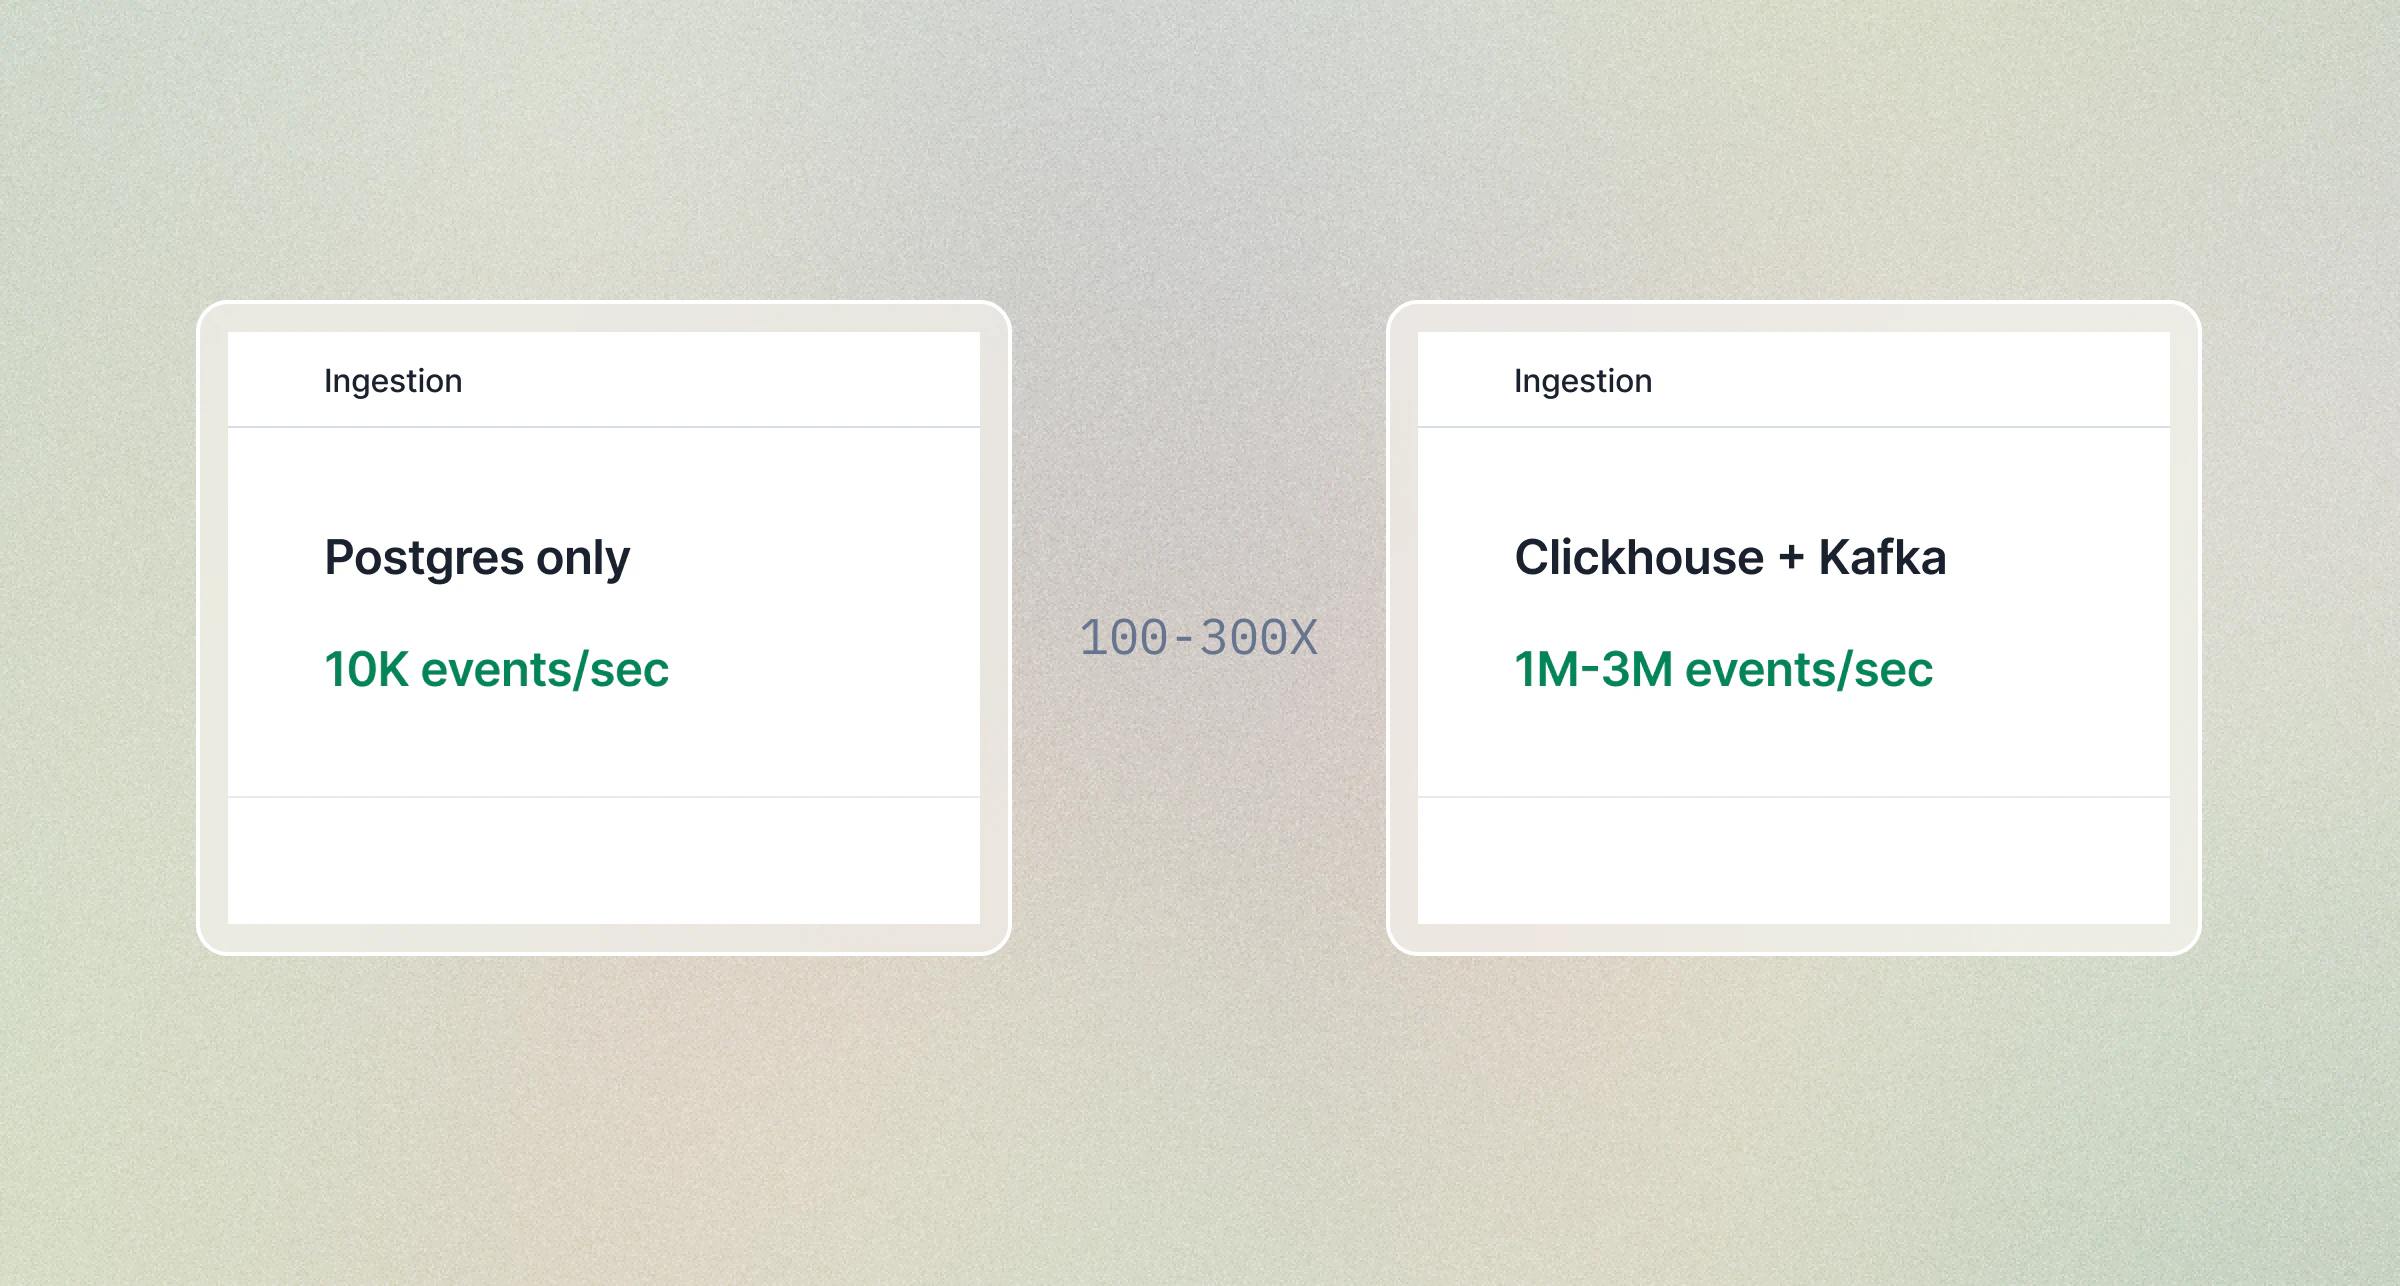 Numbers from Lago's internal load tests and customer deployments:
| What we measured | Result | Configuration |
| ------------------------------ | -------------------- | --------------------------------- |
| Sustained ingestion | **1-3M events/sec** | ClickHouse Cloud + Kafka/Redpanda |
| Postgres-only throughput | **10K events/sec** | Single Postgres instance |
| Billing aggregation latency | **\< 100ms p99** | Over 1B+ events in ClickHouse |
| End-to-end (event to billable) | **\< 2 seconds p99** | Kafka to enrichment to ClickHouse |
| Storage compression | **10-20x** | ClickHouse columnar vs. raw JSON |
## Throughput by connector
| Connector | Sustained throughput | Latency (event to billable) | Setup complexity | Best for |
| --------------------- | --------------------------- | --------------------------- | ---------------- | -------------------------------- |
| **REST API (single)** | \~1,000 events/sec | \< 500ms | Minimal | Getting started, low volume |
| **REST API (batch)** | \~10,000 events/sec | \< 500ms | Minimal | Moderate volume, no Kafka needed |
| **Kafka / Redpanda** | **1-3M events/sec** | \< 1 sec p99 | Medium | High-volume real-time pipelines |
| **Amazon Kinesis** | **100K+ events/sec** | \< 1 sec p99 | Medium | AWS-native architectures |
| **Amazon S3** | Batch, depends on file size | Depends on file size | Low | Historical backfills, migrations |
**REST batch can take you further than you think.** 10 parallel connections x 100 events per batch x 10 batches/sec = 10,000 events/sec with zero infrastructure beyond the Lago API. Many production deployments never need Kafka.
### REST API throughput optimization
Before moving to Kafka, maximize REST performance:
* **Always use the batch endpoint.** `/api/v1/events/batch` accepts up to 100 events per request.
* **Parallelize.** Send batch requests concurrently from multiple threads/workers.
* **Reuse connections.** HTTP keep-alive eliminates TLS handshake overhead.
* **Retry safely.** Events are idempotent by `transaction_id`, so retries on 429 or 5xx are always safe.
***
## Migrating from REST to Kafka
When you outgrow the REST API:
Event format is identical across all methods.
Send new events via Kafka while existing REST producers still work. Both paths feed the same pipeline.
Compare event counts and billing outputs.
Redirect all producers to Kafka.
## Pre-aggregation: an advanced optimization
If you've already maximized your connector throughput and scaled your infrastructure, but still need to reduce pipeline load, you can aggregate events at the source before sending them to Lago. This is a technique for extreme volumes; most deployments never need it.
```mermaid theme={"dark"}
flowchart TD
subgraph before["Before: Raw Events"]
R1["Millions of events/day"]
end
before --> agg
subgraph agg["Pre-Aggregation"]
direction LR
P1["Pattern 1: Dimensional Roll-ups"]
P2["Pattern 2: Hourly Roll-ups"]
end
agg --> after
subgraph after["After: Lago receives"]
A1["~4,000 events/customer/day (dimensional)"]
A2["24 events/customer/day (hourly)"]
end
```
**When it works:** Your billable metric uses `SUM`, `COUNT`, or `MAX` aggregation.
**When it doesn't:** You need per-event pricing (each event has a different amount) or per-event audit trail.
### Pattern 1: Dimensional roll-ups
This is the most common pre-aggregation pattern. It applies when your pricing depends on one or more dimensions (region, instance type, model, tier) and you use a `SUM` or `COUNT` aggregation with charge filters in Lago.
Instead of sending one event per unit of work, you aggregate all usage for each unique combination of billing dimensions into a single event per time window. Lago's charge filters still match on the dimension values in `properties`, so billing accuracy is preserved.
**Use case:** A cloud provider bills compute usage by instance type and region. Each VM emits a heartbeat every minute. That is 1,440 events per VM per day. With 400 instance types across 10 regions, raw volume can reach millions of events per customer per day.
**With dimensional roll-ups:** One event per customer per instance type per region per day. Even at 400 instance types x 10 regions, that is at most \~4,000 events/customer/day instead of millions.
```json theme={"dark"}
{
"transaction_id": "agg_cust42_compute_a100_useast_2024-03-14",
"external_subscription_id": "sub_42",
"code": "compute_hours",
"timestamp": 1710460800,
"properties": {
"instance_type": "gpu-a100-80gb",
"region": "us-east-1",
"hours": 48.5
}
}
```
The `instance_type` and `region` fields in `properties` are the dimensions that Lago's charge filters match against. Your `SUM` aggregation runs on `hours`. Because each combination is aggregated separately, the billing output is identical to sending raw events.
Multiple Lago customers run this pattern in production.
### Pattern 2: Hourly roll-ups
When your billable metric has no dimensional breakdown (e.g., total API calls, total tokens), you can collapse each hour into one event per customer. We recommend 1-hour windows as the maximum aggregation frequency to keep near-real-time billing visibility.
**Before:** 3,600 events/hour per customer (1 per second)
**After:** 1 event/hour per customer, a **3,600x volume reduction** (24 events/day instead of 86,400)
```json theme={"dark"}
{
"transaction_id": "agg_cust42_api_calls_2024-03-14T10",
"external_subscription_id": "sub_42",
"code": "api_calls",
"timestamp": 1710414000,
"properties": {
"total_tokens": 520000,
"request_count": 3600
}
}
```
This works best with `SUM` or `COUNT` aggregations where no charge filters are applied. The `transaction_id` includes the hour (`T10`) to ensure uniqueness across windows.
### Choosing an aggregation window
| Window | Trade-off |
| ------------------ | ------------------------------------------------------------------------------------------------------------------------------------------------------------------------------------------------ |
| **No aggregation** | Default. Send every event as it happens. Simplest to implement, full real-time visibility. Start here and only pre-aggregate if you hit throughput limits. |
| **1 minute** | Minimal delay. Useful when you need near-real-time billing but your raw event rate per dimension is very high (e.g., thousands of events/sec per subscription). |
| **1 hour** | Recommended for most pre-aggregation scenarios. Good balance between volume reduction and billing visibility. |
| **24 hours** | Maximum volume reduction. Usage only visible the next day. Best suited for non-critical billing where real-time visibility is not required (e.g., internal cost allocation, post-hoc reporting). |
## Monitoring checklist
| Metric | What it tells you | Alert when |
| ------------------------------- | --------------------------------------------------------------- | ----------------------------- |
| **Kafka consumer lag** | Is Lago keeping up with event volume? | Lag > 100K messages |
| **Ingestion rate** (events/sec) | Baseline throughput | > 50% deviation from baseline |
| **Enrichment latency** | Time from raw to enriched event | p99 > 2 seconds |
| **Validation failures** | Events rejected for schema errors (only applicable to REST API) | Any sustained increase |
## Data retention
**Lago Cloud:** 90 days. Data is retained for 90 days after subscription termination.
**Self-hosted:** You control retention directly through your ClickHouse and database configuration.
## Air-gapped / private network deployments
**Self-hosted Lago** runs entirely inside your infrastructure — the application, database, and streaming layer all live in your environment. No data leaves your network, regardless of which connector you use.
**Lago Cloud** requires network connectivity to Lago's managed infrastructure. What's available depends on your setup:
| Connector | Public internet | Private connectivity |
| -------------------- | --------------- | --------------------------------------------------------- |
| **REST API** | Yes | No |
| **Kafka / Redpanda** | Yes | Yes — via VPC peering between your environment and Lago's |
| **Amazon Kinesis** | Yes | No |
| **Amazon S3** | Yes | No |
For organizations that cannot send events over the public internet, Lago Cloud with **Kafka/Redpanda over VPC peering** keeps your events on a private network link. Contact the Lago team to set this up.
Numbers from Lago's internal load tests and customer deployments:
| What we measured | Result | Configuration |
| ------------------------------ | -------------------- | --------------------------------- |
| Sustained ingestion | **1-3M events/sec** | ClickHouse Cloud + Kafka/Redpanda |
| Postgres-only throughput | **10K events/sec** | Single Postgres instance |
| Billing aggregation latency | **\< 100ms p99** | Over 1B+ events in ClickHouse |
| End-to-end (event to billable) | **\< 2 seconds p99** | Kafka to enrichment to ClickHouse |
| Storage compression | **10-20x** | ClickHouse columnar vs. raw JSON |
## Throughput by connector
| Connector | Sustained throughput | Latency (event to billable) | Setup complexity | Best for |
| --------------------- | --------------------------- | --------------------------- | ---------------- | -------------------------------- |
| **REST API (single)** | \~1,000 events/sec | \< 500ms | Minimal | Getting started, low volume |
| **REST API (batch)** | \~10,000 events/sec | \< 500ms | Minimal | Moderate volume, no Kafka needed |
| **Kafka / Redpanda** | **1-3M events/sec** | \< 1 sec p99 | Medium | High-volume real-time pipelines |
| **Amazon Kinesis** | **100K+ events/sec** | \< 1 sec p99 | Medium | AWS-native architectures |
| **Amazon S3** | Batch, depends on file size | Depends on file size | Low | Historical backfills, migrations |
**REST batch can take you further than you think.** 10 parallel connections x 100 events per batch x 10 batches/sec = 10,000 events/sec with zero infrastructure beyond the Lago API. Many production deployments never need Kafka.
### REST API throughput optimization
Before moving to Kafka, maximize REST performance:
* **Always use the batch endpoint.** `/api/v1/events/batch` accepts up to 100 events per request.
* **Parallelize.** Send batch requests concurrently from multiple threads/workers.
* **Reuse connections.** HTTP keep-alive eliminates TLS handshake overhead.
* **Retry safely.** Events are idempotent by `transaction_id`, so retries on 429 or 5xx are always safe.
***
## Migrating from REST to Kafka
When you outgrow the REST API:
Event format is identical across all methods.
Send new events via Kafka while existing REST producers still work. Both paths feed the same pipeline.
Compare event counts and billing outputs.
Redirect all producers to Kafka.
## Pre-aggregation: an advanced optimization
If you've already maximized your connector throughput and scaled your infrastructure, but still need to reduce pipeline load, you can aggregate events at the source before sending them to Lago. This is a technique for extreme volumes; most deployments never need it.
```mermaid theme={"dark"}
flowchart TD
subgraph before["Before: Raw Events"]
R1["Millions of events/day"]
end
before --> agg
subgraph agg["Pre-Aggregation"]
direction LR
P1["Pattern 1: Dimensional Roll-ups"]
P2["Pattern 2: Hourly Roll-ups"]
end
agg --> after
subgraph after["After: Lago receives"]
A1["~4,000 events/customer/day (dimensional)"]
A2["24 events/customer/day (hourly)"]
end
```
**When it works:** Your billable metric uses `SUM`, `COUNT`, or `MAX` aggregation.
**When it doesn't:** You need per-event pricing (each event has a different amount) or per-event audit trail.
### Pattern 1: Dimensional roll-ups
This is the most common pre-aggregation pattern. It applies when your pricing depends on one or more dimensions (region, instance type, model, tier) and you use a `SUM` or `COUNT` aggregation with charge filters in Lago.
Instead of sending one event per unit of work, you aggregate all usage for each unique combination of billing dimensions into a single event per time window. Lago's charge filters still match on the dimension values in `properties`, so billing accuracy is preserved.
**Use case:** A cloud provider bills compute usage by instance type and region. Each VM emits a heartbeat every minute. That is 1,440 events per VM per day. With 400 instance types across 10 regions, raw volume can reach millions of events per customer per day.
**With dimensional roll-ups:** One event per customer per instance type per region per day. Even at 400 instance types x 10 regions, that is at most \~4,000 events/customer/day instead of millions.
```json theme={"dark"}
{
"transaction_id": "agg_cust42_compute_a100_useast_2024-03-14",
"external_subscription_id": "sub_42",
"code": "compute_hours",
"timestamp": 1710460800,
"properties": {
"instance_type": "gpu-a100-80gb",
"region": "us-east-1",
"hours": 48.5
}
}
```
The `instance_type` and `region` fields in `properties` are the dimensions that Lago's charge filters match against. Your `SUM` aggregation runs on `hours`. Because each combination is aggregated separately, the billing output is identical to sending raw events.
Multiple Lago customers run this pattern in production.
### Pattern 2: Hourly roll-ups
When your billable metric has no dimensional breakdown (e.g., total API calls, total tokens), you can collapse each hour into one event per customer. We recommend 1-hour windows as the maximum aggregation frequency to keep near-real-time billing visibility.
**Before:** 3,600 events/hour per customer (1 per second)
**After:** 1 event/hour per customer, a **3,600x volume reduction** (24 events/day instead of 86,400)
```json theme={"dark"}
{
"transaction_id": "agg_cust42_api_calls_2024-03-14T10",
"external_subscription_id": "sub_42",
"code": "api_calls",
"timestamp": 1710414000,
"properties": {
"total_tokens": 520000,
"request_count": 3600
}
}
```
This works best with `SUM` or `COUNT` aggregations where no charge filters are applied. The `transaction_id` includes the hour (`T10`) to ensure uniqueness across windows.
### Choosing an aggregation window
| Window | Trade-off |
| ------------------ | ------------------------------------------------------------------------------------------------------------------------------------------------------------------------------------------------ |
| **No aggregation** | Default. Send every event as it happens. Simplest to implement, full real-time visibility. Start here and only pre-aggregate if you hit throughput limits. |
| **1 minute** | Minimal delay. Useful when you need near-real-time billing but your raw event rate per dimension is very high (e.g., thousands of events/sec per subscription). |
| **1 hour** | Recommended for most pre-aggregation scenarios. Good balance between volume reduction and billing visibility. |
| **24 hours** | Maximum volume reduction. Usage only visible the next day. Best suited for non-critical billing where real-time visibility is not required (e.g., internal cost allocation, post-hoc reporting). |
## Monitoring checklist
| Metric | What it tells you | Alert when |
| ------------------------------- | --------------------------------------------------------------- | ----------------------------- |
| **Kafka consumer lag** | Is Lago keeping up with event volume? | Lag > 100K messages |
| **Ingestion rate** (events/sec) | Baseline throughput | > 50% deviation from baseline |
| **Enrichment latency** | Time from raw to enriched event | p99 > 2 seconds |
| **Validation failures** | Events rejected for schema errors (only applicable to REST API) | Any sustained increase |
## Data retention
**Lago Cloud:** 90 days. Data is retained for 90 days after subscription termination.
**Self-hosted:** You control retention directly through your ClickHouse and database configuration.
## Air-gapped / private network deployments
**Self-hosted Lago** runs entirely inside your infrastructure — the application, database, and streaming layer all live in your environment. No data leaves your network, regardless of which connector you use.
**Lago Cloud** requires network connectivity to Lago's managed infrastructure. What's available depends on your setup:
| Connector | Public internet | Private connectivity |
| -------------------- | --------------- | --------------------------------------------------------- |
| **REST API** | Yes | No |
| **Kafka / Redpanda** | Yes | Yes — via VPC peering between your environment and Lago's |
| **Amazon Kinesis** | Yes | No |
| **Amazon S3** | Yes | No |
For organizations that cannot send events over the public internet, Lago Cloud with **Kafka/Redpanda over VPC peering** keeps your events on a private network link. Contact the Lago team to set this up.